|
BIOTRONICS3D |
|
3Dnet™ Medical Cloud |
|
User’s Manual |

3DnetTM Medical Cloud User’s Manual Version: 1.15. Updated: 02/08/2016.
© Biotronics3D Ltd. 2016, 5 Greenwich View Place, City Reach, Millharbour,
London, E14 9NN
Proprietary
Notice and Disclaimer
The information herein disclosed is the property of Biotronics3D Ltd.
Information in this document is subject to change without notice and does not
represent a commitment by Biotronics3D to incorporate changes or improvements
in software previously sold or installed. No part of this document may be
reproduced or transmitted in any form, electronic or mechanical, including
photocopying and recording, for any purpose other than the purchaser's own use
without the express written permission of Biotronics3D or its authorized
resellers.
Copyright
Copyright© Biotronics3D Ltd. 2004-2016. All rights reserved.
Trademarks
3DnetTM and
Biotronics3DTM are trademarks of Biotronics3D. All other trademarks
are the property of their respective owners and are hereby acknowledged.
Contact Information
Biotronics3D Ltd
5 Greenwich View Place,
City Reach
Millharbour
London, E14 9NN, UK
Tel: +44 (0) 207 093 0903
Email: support@biotronics3D.com
Web: www.biotronics3d.com ; www.3dnetmedical.com
Contents
3.4 Setting up hanging protocols
4.1 Operations with study series
4.4 Measurements and annotations
5 Image processing and visualization
5.2 Multiplanar reformatting (MPR)
5.4 Hounsfield units and ROI densities
5.6 Maximum intensity projection (MIP)
5.8 Compressing images before streaming
11 Advanced clinical software applications
1 Introduction
3DnetTM Medical Cloud is a DICOM
3.0 compliant, web-based system for medical imaging, archiving, distribution
and visualization.
3Dnet™ enables healthcare professionals to
access their work at anytime and anyplace using a zero footprint client. By
combining a feature-rich multimodality web viewer and progressive streaming, 3Dnet™
delivers unprecedented visualization performance at diagnostic quality for
large datasets even over low Internet bandwidths. 3Dnet™ streams only the
medical image not the entire desktop as it is with many other vendors in the
indudstry.
3Dnet™ Medical Cloud is built on a
three-tier server/thin-client architecture, which includes a Silvelight-based
GUI, core server applications developed in C/C++/C# and the Microsoft SQL
database.
3Dnet™ is 100% server based, meaning that
all applications are installed on the server and no software is installed on
the client computer. All data remains on the server and all processing is done
on the server, only the processing result is transfered to the client computer.
3Dnet™ supports the current industry
standards for security and confidentiality: HIPAA, UK DoH, HITECH ACT, FDA, IHE
ATNA. Access to the system requires username and password and the communication
between server and clients is protected with minimum 128 bit SSL encryption.
2 My user account
2.1 Logging in
On the MAIN page click on the Log In Button

Enter your username and password then click Log In.
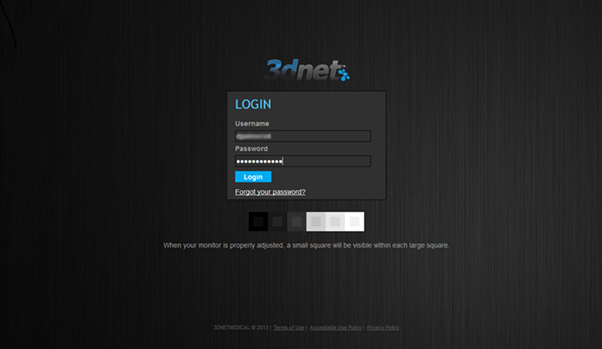
Note the contents of this box regarding
your monitor setup.
2.2 Edit profile
Click on Profile in the left menu to change your password, edit personal information and application settings
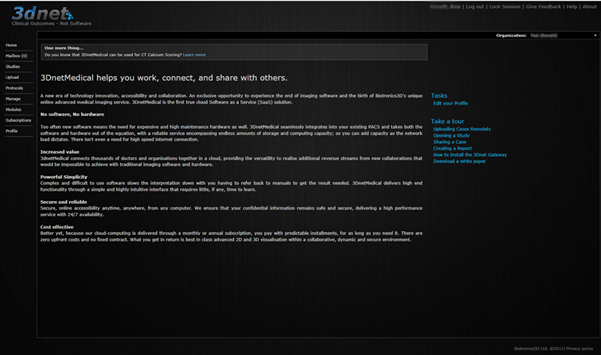
3Dnet™
welcome page.
Ensure you complete a Security Question from the drop down list as you will need
this is you forget your password.
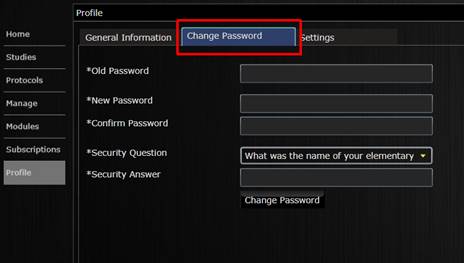
Changing the password.
Click on the settings tab to modify the following
settings:
- Language – sets desired user interface language.
- Native Browser
Communication: enables browser level communication rather than silverlight
level communication to avoid firewall blocking.
- Reporting in viewer: enables report text editor to open in the viewer
rather than in the study browser window.
- Enable Notifications: enables user email notifications.
- Notification Interval: sets interval between email notifications, in minutes.
- Continuous Annotation Mode: enables repeated measurements with the selected tool.
- Simplified Cursor Display: disables curser icons in the viewer, instead displays
the current operation mode on the right side of the viewport.
- Open Study Panel at start: enables Study Panel (series, snapshots, annotaions) in
the Viewer to be opened by default.
- Open Originals (CT, MRI)
by default: enables default display of only then thin slices
or the original data within a CT/MRI study.
- Sync. scrolling by default: enables synchronous scrolling of all connected
viewports.
- Display ext. cross ref.
Lines by default: enables the display of
cross-reference lines of all connected viewports.
- Maximise viewport on
double-click: enables
double click to maximise viewport.
- Studies listed per page: sets number of studies to be display per page in the
study browser.
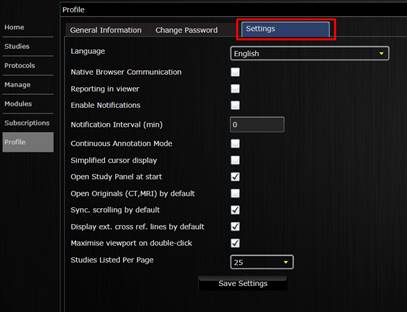
Modify account settings
3 Study browser
3.1 Accessing the study list
Click on the Studies tab in the left menu of the
welcome page.
Welcome page.
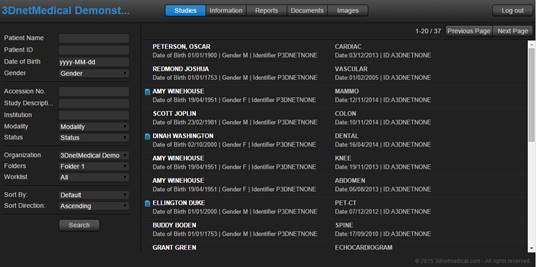
A page
similar to this will display a list of studies currently available in the organization
(surname, firstname, Patient ID, Accession Number, Study Description, Number of
images, etc). A certain patient or study can be found quickly by searching for
Patient Name, Patient ID or Accession Number. Type the information in the
appropriate box and hit the <Enter>
key. The list can also be filtered using various criteria: date, modality,
institution, etc.
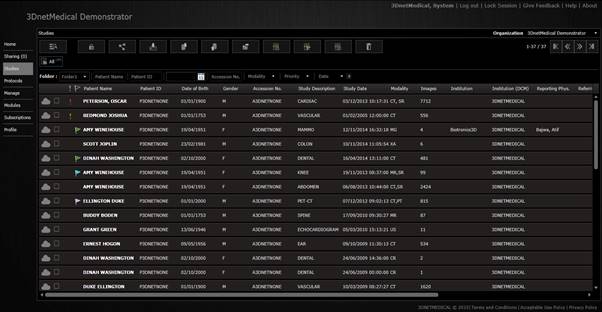
Study browser.
The colour of the flag icon next to a study indicates the status of the
study
![]() Performed
Performed
![]() Dictated
Dictated
![]() Transcribed
Transcribed
![]() Final Reported
Final Reported
![]() Addendum
Reported
Addendum
Reported
![]() A red
exclamation mark indicates that the priority of the study is CRITICAL.
A red
exclamation mark indicates that the priority of the study is CRITICAL.
![]() A yellow
exclamation mark indicates that the priority of the study is URGENT.
A yellow
exclamation mark indicates that the priority of the study is URGENT.
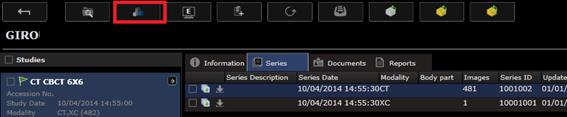
In the study browser, the user
can perform the following operations on studies, accessible in the upper horizontal
buttons menu (a studies must be checked beforehand):
![]() Share studies (via email link)
Share studies (via email link)
![]() Export studies to disk
Export studies to disk
![]() Send studies to PACS (via gateway)
Send studies to PACS (via gateway)
![]() Import new studies
Import new studies
![]() Move studies to an alternate folder
Move studies to an alternate folder
![]() Assign stu studies dy to a user/insitution
Assign stu studies dy to a user/insitution
![]() Change studies status
Change studies status
![]() Change studies priority
Change studies priority
![]() Delete studies
Delete studies
![]() Lock studies
Lock studies
![]() Search Study
Search Study
![]() Local study
Local study
![]() preloaded
study
preloaded
study
![]() Remote
study
Remote
study
After clicking on a study record,
a new page is opened showing the series of that study, together with all the
prior studies of that patient, reports and other medical documents attached.
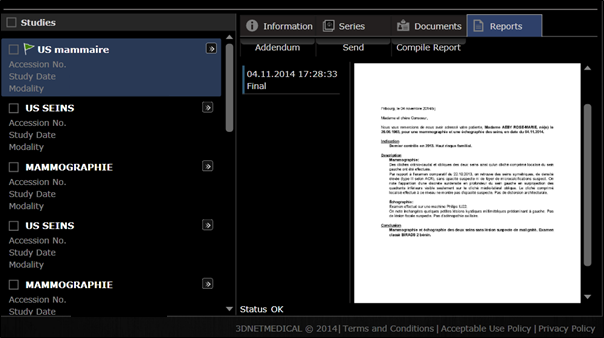
Accessing the report.
The reports edited and saved in
the 3Dnet™ system directly or received from third-party applications via HL7
messages can be stored and attached to the patient records in various formats,
including PDF or text.
To display the images of a study,
the user has two options:
1) Click the load button ( ![]() ) to open all images.
) to open all images.
2) Check the apropriate series under
the series tab and then press the load button to open all images of only the
selected series.
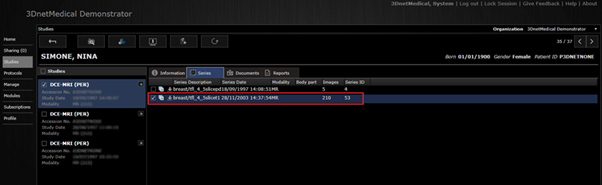
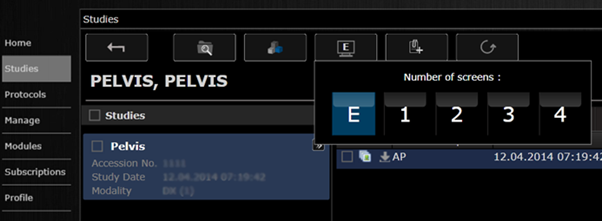
Patient studies and series panel.
On this page the user can also
set the number of monitors used to display images by clicking this button ![]() (E
option represents embeded viewer, no
popup).
(E
option represents embeded viewer, no
popup).
Click on ![]() to go back to the patient list.
to go back to the patient list.
Click on ![]() to load the study with a specific module (clinical
application).
to load the study with a specific module (clinical
application).
Click on ![]() to attach documents or images to the patient
record.
to attach documents or images to the patient
record.
3.2
Opening a study
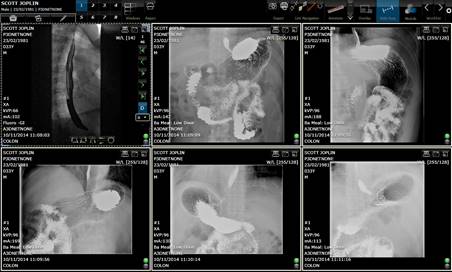
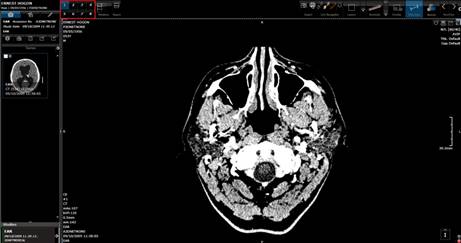
When opening
a study, the application displays all the series of that study in the grid mode
(lightbox).
All series display.
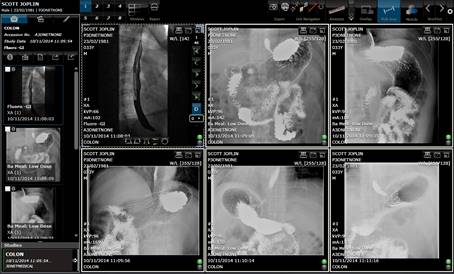
Click on the ![]() button in the
upper left corner of the viewer to open the Study Panel. Here, all the series
of the current study are showed in thumbnail format and underneath the all the
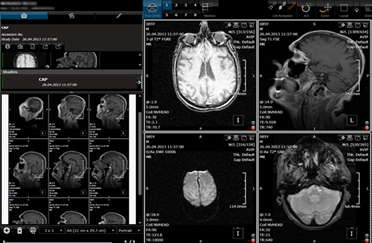
other studies of that patient are displayed, as in the figure below. From the Study
Panel the series can be draged & droped into the viewports for
visualization.
button in the
upper left corner of the viewer to open the Study Panel. Here, all the series
of the current study are showed in thumbnail format and underneath the all the
other studies of that patient are displayed, as in the figure below. From the Study
Panel the series can be draged & droped into the viewports for
visualization.
![]()
Study Panel is shown on the left with all
series in the study shown as thumbnails and all other studies of the patient
shown below that.
The Study Panel presents a top bar menu from
where the user can visualize information about the study ![]() , order forms
, order forms ![]() , reports
, reports ![]() , can send the selected series to a DICOM node
, can send the selected series to a DICOM node ![]() or can import a study
or can import a study ![]() .
.
3.3 Writing a report
3Dnet™ has a built-in text editor where the
radiologist can type the result. Depending on how Report in viewer option was set in the user profile, the reporting
feature can be launched from the study browser by clicking on the Report tab, or in the viewer by clicking
the pencil icon ![]() in the top tool bar. Click on
the New button to open the text
editor.
in the top tool bar. Click on
the New button to open the text
editor.
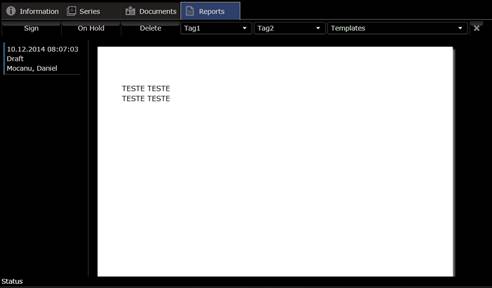
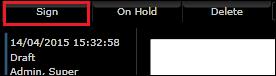
Click On-hold button to save your work for later.
Click Sign button if you want to sign the report. Here are several options: Preliminary, Final, Transcribed and Dictated. A report in the Preliminary state can still be modified. A report in the Final state cannot be modified, from then on only addendums can be created.
3.4 Setting up hanging protocols
The system offers a powerful and flexible tool for defining hanging protocols. To access this feature, click on tha Protocols tab on the left of your screen. A new page is displayed, showing the protocols already set up. A hanging protocol can be made for a specific user or for the entire organization.
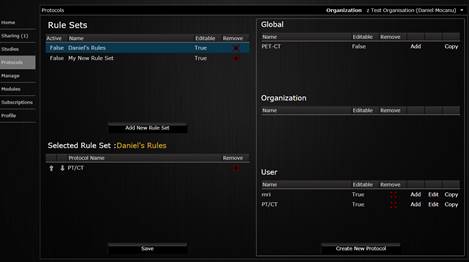
Hanging protocols main page.
To create a new protocol, click on the Create New Protocol button on the lower right part of the screen. From this point forward, you will be asked to define the structure of the protocol. First the user needs to enter a name for the protocol and to define the number of screens (monitors) that are used.
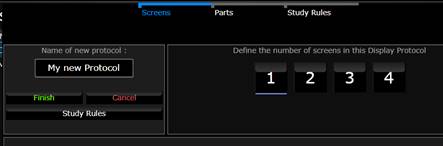
Pick the number of monitors used for a
protocol.
Next define the number of Workspaces of the haning protocol by clicking on the desiered number:
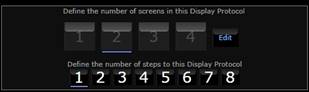
Number of steps in the protocol.
Click on the Layout button to choose a desired layout. Press the Next button. Press Create New Rule button. Here you can select the appropriate condition used by the Viewer to display the series/acquisitions in the correct position on that monitor. Once the rules are defined for each of the vieports on all monitors, click the Next button to position your series/acquisition of each viewport: Center, Left, Right. At the end of the process, save your work by clicking the green button Finish.
4 Advanced viewer features
4.1 Operations with study series
3Dnet™ offers advanced functionalities for series manipulation in the viewing area. Below are some of the operations that can be performed to help the radiologist diagnose a case quicker:
-
To add series into the viewing
area, Drag & Drop a series from the Study Panel into the desired
viewport. The user has the options to replace or to insert to the right, left,
above or below the active viewport.
-
To swap series between 2
viewports, press the <Shift> key and Drag & Drop
the active series into the desired viewport. The available options are:
swap, copy, move, insert below/above/left/right.
-
To remove a series from the
viewing area:
1) the key combination <Ctrl+Delete> removes the series and leaves
the active viewport empty.
2) the key combination <Shift+Delete> removes the entire viewport
from the viewing area and shifts all the remaining series to the left.
-
To replace the series
thumbnails of the current study with the series thumbnails of another study of
that patient, click once on the desired study in the study list right
underneath the thumbnails, in the lower left corner of the screen.
-
To add a series of another
study into the viewing area, Drag & Drop from the series thumbnails
into the desired viewport. Different studies in the viewing areas are marked
with different colors.
-
To populate
the viewing area with a different study of that patient, click on the
right-pointing arrow icon of the desired study in the left-bottom corner list.
-
To activate a viewport, click on it.
-
To maximize a viewport, double click on it, if
the “maximise” viewport on double-click option in the user profile is enabled.
Alternatively, a viewport is maximised by clicking on the top right corner.
-
To scroll through a series use the wheel on your mouse or
move the mouse to the right or bottom part of the viewport and drag it on the
screen (see the Hot Spot section of this User Manual).
-
To navigate through the series of a study
in the active viewport, press the <Tab> key.
Additionally, the user has the option to dispaly
only the original images (thin-slices in case of CT), only the reconstructed
images or only the localizers. This is achieved by clicking on the Series tab in the Study Panel. This
will change the thumbnail display to show only Original series, the Derived
series or the Localizers.
Click the arrow ![]() to display the selected option (in this case only
the original series).
to display the selected option (in this case only
the original series).
4.2
Linked series
navigation
Synchronous navigation between viewports can be
achieved by activating the buttons ![]() in the top menu bar or by shortcut keys.
in the top menu bar or by shortcut keys.
![]() or
or ![]() Toggles
on/off frame of reference with cross-reference lines. Press the <L> key displays slice lines.
Press again to hide them.
Toggles
on/off frame of reference with cross-reference lines. Press the <L> key displays slice lines.
Press again to hide them.
![]() or
or ![]() Toggles
on/off synchronized navigation in all series with respect to active area.
Toggles
on/off synchronized navigation in all series with respect to active area.
![]() or
or ![]() Toggles on/off cursor cross-snaps in all series
with respect to the active series area
Toggles on/off cursor cross-snaps in all series
with respect to the active series area
![]() toggles/on/off the orientation in all series
with respect to the active series area.
toggles/on/off the orientation in all series
with respect to the active series area.
If the user desires a different window layout, he
can select the desire format from the top bar menu.
 Here, the user can interactively select the
number of rows and columns of the desired viewport.
Here, the user can interactively select the
number of rows and columns of the desired viewport.
4.3
Screen layout
On the top tool
bar, click on the two little arrows next to the Layout button to display all
the layout options.
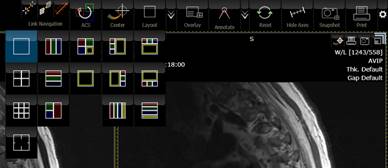
Selecting a layout.
There are a number of predefined
layouts. The ones with the colored box are for 3D visualization:
MPR90(multi-plannar reformation), VR(volume rendering), MIP(maximum intensity
project) and MiniIP (minimum intensity projection).
4.4
Measurements
and annotations
In the top tool bar, click on the two little arrows next to the Annotate
button to display all the measurement and annotation tools: distance, angle,
Caliper angle, circle circumference/area, polygon, poly line, label, arrow,
pixel HU (Hounsfield Unit) probing, parallel lines, region growing
segmentation. In order to allow continuous annotations with the same tool,
click on the Pin symbol to point downwards ![]() .
.
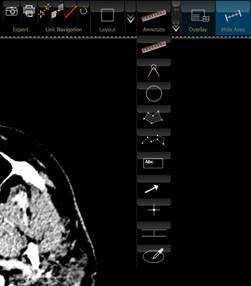
The Annotations and Measurements panel.
All measurements and annotations
will be listed in the Annotation panel on the left side of the screen. The “eye”
symbol toggles on/off the annotations in the active viewing area. The user can
delete a measurement by clicking on the red cross in the Annotation panel or by
selecting it in the viewing area and pressing the <Delete> key. There is also a Delete All annotations button
available in the lower part of the Annotation panel. To restore the state,
click on the desired measurement in the Measurement panel.
4.5
 Snapshots
The Snapshot function
![]() is also available in the right toolbar in each
viewport. This function allows the user to store a ‘snapshot’ of an image (with
annotations, measurements, etc) that can then be sent back to the archive for
future reference.
is also available in the right toolbar in each
viewport. This function allows the user to store a ‘snapshot’ of an image (with
annotations, measurements, etc) that can then be sent back to the archive for
future reference.
Process:
F Make the changes to the image (measurements, arrows, text, etc)
F Click on the Snapshot icon ![]() to capture an image
to capture an image
F Open the Snapshot tab
F Tick the little white box on the image stamp(s) that you wish to send back
to PACS
F Click Send
In the figure below, the snapshot panel is shown on the left. The user can
save the snapshot to 3Dnet™ cloud archive as a stand alone series, can send it
to a different DICOM node in the network, print it out or attached it to a
report. The viewer also allows to restore application state by dragging and
dropping the snapshot into a viewport.
The snapshot panel on the left.
4.6
Workspaces
The application offers the
possibility to define multiple workspaces where the user can set up different simultaneous
layouts for image visualization. A Hanging Protocol can also have workspaces.
Click the numbers in the Top Tool Bar of the viewer to navigate through
workspaces and to configure different layouts, window/level settings,
visualization modes.
Different workspaces can be created by
clicking on the numbers in the upper tool bar.
5
Image
processing and visualization
5.1
Basic functions
To facilitate image processing
and visualization, 3Dnet™ implemented the concept of hot spot regions in the
viewport. The left mouse button (LMB) function changes according to the cursor
position inside a viewport. This feature allows easy access to: window/level,
pan, zoom, scroll images, series rotate. The following picture shows the hot
spot regions with the associated function.
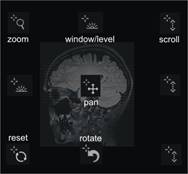
For example, if the user places
the mouse cursor in the upper left side of the viewport and clicks the left
mouse button, the system will perform window/level. Series Free Rotation is
achieved by moving the mouse to the bottom of a vieport and pressing the <Control> key. Window/Level can
also be performed anywhere in the image by right clicking and dragging the
mouse.
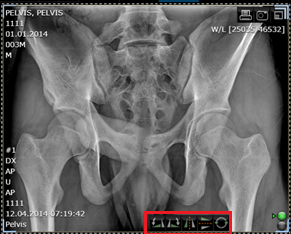
For 2D radiological images, the
system displays a separate tool bar in the lower right corner of the viewport.
It offers the following operations: 90o rotation,
horizontal/vertical flip, reset.
To invert the grayscale of an image, click on the W/L text in the upper
right corner of the viewport and select the Color Map Inv. Gray. This will
display the image in negative mode.
5.2
Multiplanar
reformatting (MPR)
To analyze images using MPR, a 3D
layout must be selected first from the Layout
panel in the Top Tool Bar.
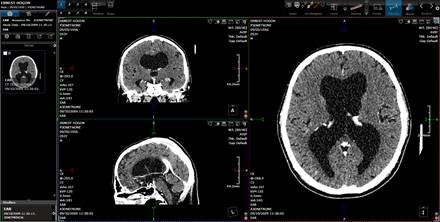
MPR view.
By clicking on the cross-hair and
draging it, one can obtain reformats on arbitrary orthogonal directions.
5.3
Batch MPR
3Dnet™ offers a powerful tool to
create batch MPR from the original volume dataset. The new series can be
generated along plan-paralel and radial directions and can be saved to the PACS
archive as a separate series.
Process:
F Select a 3D Layout, for example ![]()
F On the right
side of the 3D viewport (the largest viewport on your screen), click on ![]() icon for plannar reformatting or
icon for plannar reformatting or ![]() for radial reformatting.
for radial reformatting.
F In the 3D
viewport click on Gap text in the
right upper corner of the viewport to select the slice thickness
F In the same
menu area, click on Extent text to select the extent of the new series.
F Click on the
reformat icon ![]() to create the new series.
to create the new series.
F The new series
will be displayed in the Snapshot panel on the left side of the screen. To save
the series to PACS, check the white box, select the DICOM node from the drop
down menu above and click Send.
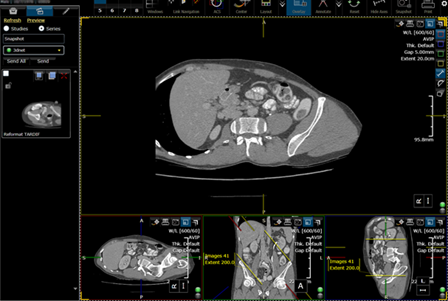
Batch MPR.
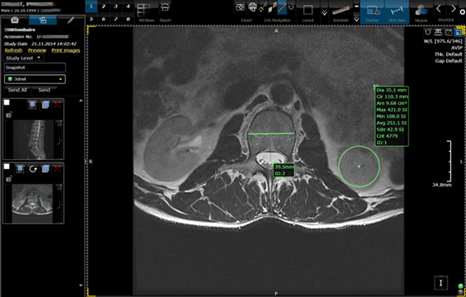
5.4
Hounsfield
units and ROI densities
In the grid (lightbox) layout,
press the <u> key to show
Hounsfield units on mouse movement across the image. The HU value is displayed
in the lower left corner of the viewport. If you are in a 3D layout, probing
for Hounsfield units (HU) is achieved by dragging the cross-hair on the screen.
For measuring densities, one must first select a measurement tool from the
Annotate tab and then draw a shape on the image to enclose a desire region of
interest. The application will display information about geometrical
measurements as well as HU statistics (min, max, average and standard
deviation).
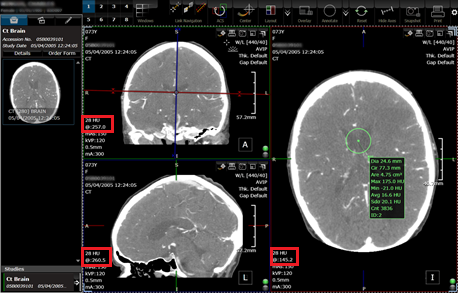
Hounsfield units probing.
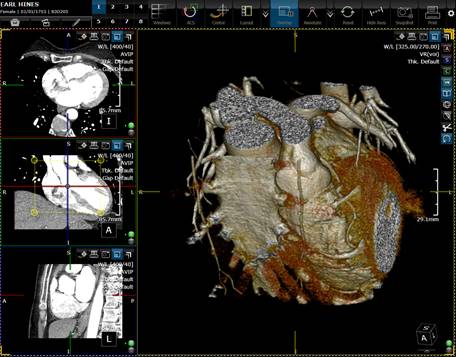
5.5
Volume
rendering (VR)
There are several layouts
available in 3Dnet™ that allow Volume Rendering visualization.
Process:
F Select the
desired 3D Layout (the ones with the
yellow inner square), for example ![]()
F Click on the
yellow square ![]() in the upper right side of the main viewport.
in the upper right side of the main viewport.
F A Volume
Rendering image is generated.
F To rotate the
image, press the left button of the mouse and drag it on the screen.
F 3D Window/Level
(transfer function) can be modified directly by right clicking and dragging on
the screen or from the slide bars shown after clicking on the text W/L [257.00, 250.00] present in the upper right corner of the main
viewport. A drop down form appears, from which the user can also select Presets for the VR transfer function or
apply various filters to adjust the visibility of certain regions.
To isolate a region of interest
in VR mode, the user can select the clipping feature on the right side of the
VR viewport (box clipping, plane clipping, ellipse clipping). The shape can be
resized and repositioned on all three three orthogonal views on the left side
of the screen.
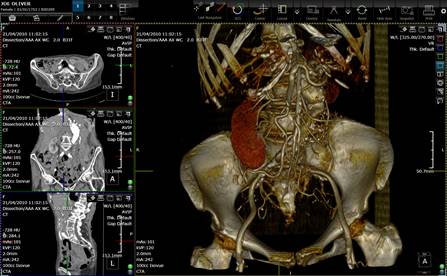
Volume rendering.
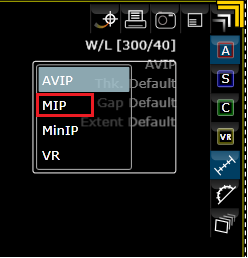
5.6
Maximum
intensity projection (MIP)
The MIP mode can be selected from
the drop down menu available in the right upper corner for the 3D viewport
(click on text).
Sliding Slab MIP
To look at the date using sliding
slab MIP the user must follow the following steps:
Process:
F Select the MIP mode
F Click on Thickness and
uncheck Default
F Select the
thickness of the slab
F Select the
desired Window and Level by pressing W/L
text
F Use the mouse
wheel to navigate through the volume
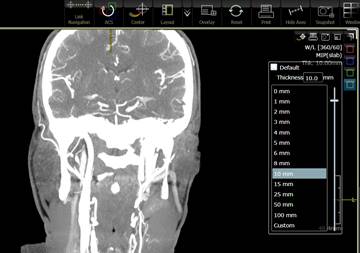
Sliding slab MIP.
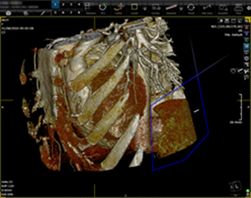
5.7
Sculpting tool
There are several ways to isolate
a volume of interest (VOI) in 3D VR mode.
Use the box clip ![]() , ellipse clip
, ellipse clip ![]() , or plane clip
, or plane clip
![]() tools from the right vertical toolbar in the
3D free viewport as shown in the figure below. On the axial, sagital and
coronal views, resize the yellow square by dragging from its corners. Only the
region inside the yellow square will be displayed in the VR mode.
tools from the right vertical toolbar in the
3D free viewport as shown in the figure below. On the axial, sagital and
coronal views, resize the yellow square by dragging from its corners. Only the
region inside the yellow square will be displayed in the VR mode.
Volume of interest defined with a cubical
form.
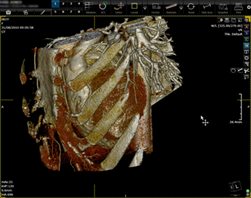
A custom sculpting tool is also
available in 3Dnet.
Process:
F Press the scissors button ![]() in the 3D free viewport
in the 3D free viewport
F Press the scalpel button ![]() and draw a shape
and draw a shape
F Double click to
finish the shape
F Click on the
side you want it sculpted out (interiour or exterior of the shape)
F Press the reset ![]() button to bring back the initial VR display.
button to bring back the initial VR display.
5.8
Compressing
images before streaming
To facilitate
teleradiology on low network bandwidths, 3Dnet™ allows the user to configure
the application to compress the images before sending them from the server to
the client workstation. The compression algorithm is JPEG with a compression
rate up to 144:1 (lossy compression). Click on the gearwheel ![]() located in the upper right corner
of the screen to open the image compression slide bar. Click on the Lossy red
dot and slide to the desired quality. The picture below shows the 3Dnet™ web client and a
compressed CT image with a JPEG compression quality of Q=5.
located in the upper right corner
of the screen to open the image compression slide bar. Click on the Lossy red
dot and slide to the desired quality. The picture below shows the 3Dnet™ web client and a
compressed CT image with a JPEG compression quality of Q=5.
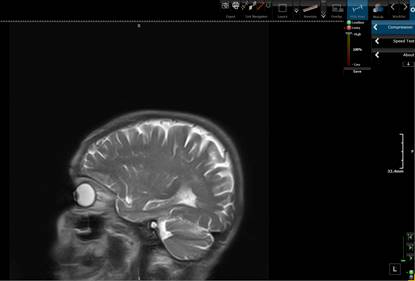
Image with orginal quality.
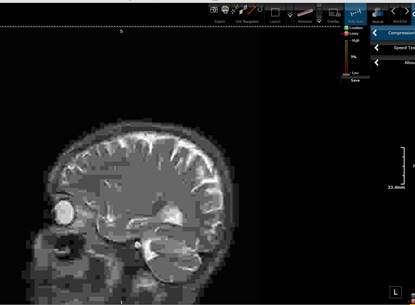
Compressed image with very low quality.
For large images, such as MG or DX/CR, the transmission is performed using progressive refinement. First, a low resolution image is sent to the client for fast visualization, while the rest of the content is sent in the background, until the full resolution is displayed. The process usually takes 2-5 seconds, depending on the size of the image and network bandwitdth.
6 Print tools
3Dnet™ offers both paper print on
Windows printers and film print on DICOM printers.
6.1
Windows paper
print
First, make sure a Windows
printer is installed on your computer. To print an image, click on the ![]() button located in the top toolbar of the
viewer. To print from a viewport only, press the print button located in the
upper right side of the viewport.
button located in the top toolbar of the
viewer. To print from a viewport only, press the print button located in the
upper right side of the viewport.
6.2
DICOM film
print
A DICOM printer must be set up in
3Dnet™ before printing on films (with printer AET, Port, IP). 3Dnet™ incorporates
a powerful DICOM print tool which offers several ways to add images on the film
sheets:
1) Drag & Drop images
directly from the viewports to the film sheet;
2) Take snapshots of the desired
images first and then Drag & Drop from the Snapshot panel into the print
tool;
3) Drag & Drop a series from
the Study Panel to the film sheet to print an entire series. The print tool is
launched by clicking on the ![]() button in the left side of the top tool bar. The print panel is displayed on the left side of the
viewer. Select a desired layout from the combo box on the lower side of the print
panel.
button in the left side of the top tool bar. The print panel is displayed on the left side of the
viewer. Select a desired layout from the combo box on the lower side of the print
panel.
DICOM print tool.
Option 1)
Drag & Drop images from the
viewports into the print tool using the combination <Shift>+Left mouse button.
Option 2)
While viewing a study, take
snapshots of the images you want to print by using the camera button ![]() . With the
Print (DCM) button activated (blue), open the Snapshot panel.
. With the
Print (DCM) button activated (blue), open the Snapshot panel.
Add the snapshots to the film
sheet by simply dragging it from the Snapshot panel with the left mouse button.
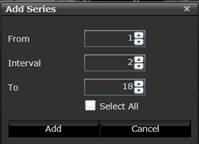
Option 3)
Open the Study Panel and Drag
& Drop the desired series to the film sheet in the print tool. 3Dnet™ displays
a new window on which the user can select the range of images to be printed and
the interval. Click Add button.
In the Print tool, the user can
modify the window/level, pan or zoom of the image using the hotspots. To delete
the current page from the print tool click on ![]() button found in the upper right corner of that
page.
button found in the upper right corner of that
page.
Other operations:
![]() Add page
Add page
![]() Delete all pages
Delete all pages
![]() Print button.
Print button.
7 3Dnet™ mobile portal
3Dnet™ offers a zero footprint,
HTML-based web portal for referring physicians and patients with features that
make meaningful patient data (images, results) ubiquitously available when and
where it is needed, inside or outside the hospital, thus accelerating workflow
and improving healthcare. The portal is easily accessible on any mobile
devices, such as tablet PCs and intelligent cell phones. There is no need to
download and install any software application on your device. Just open your
preferred web browser and type your username and password. Images and results
are streamed to you. As shown in the figure below, the user can search the
database by name, date, modality or site. The viewer includes basic image
manipulation features such as: window/level, zoom, pan, scroll.
Study browser of the mobile HTML-based
portal.
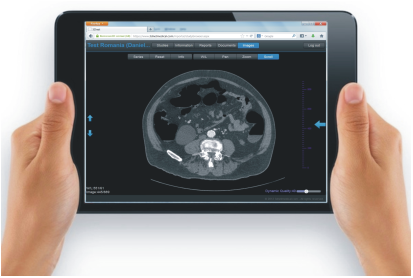
The portal runs on tablet PCs and smart
phones. It offers basic viewing functions: window/level, scroll, pan, zoom.
8 Collaborative tools
3Dnet™ Medical supports several software tools which enable data sharing and collaboration:
1. Share study
2. Assign study
3. Folders
8.1 Share study
Using the “Share Study” feature, a
radiologist, or a user in general, can share a study with his colleagues for
second opinion or can offer acces to the same study to a specialist doctor
(e.g. surgeon, neurologist, etc.). The feature is also useful to offer patient
access to their studies. The tool is easily accessible from the Study Browser
top tool bar by pressing the ![]() butto (the study must ticked
first). The application then displays a dialog box like in the figure below,
where the user is required to enter the Name of the recipient, his Email,
Username (if he already has one), a Pin number. There is an option to
anyonymize the study by ticking “Hide Demographics” box.
butto (the study must ticked
first). The application then displays a dialog box like in the figure below,
where the user is required to enter the Name of the recipient, his Email,
Username (if he already has one), a Pin number. There is an option to
anyonymize the study by ticking “Hide Demographics” box.
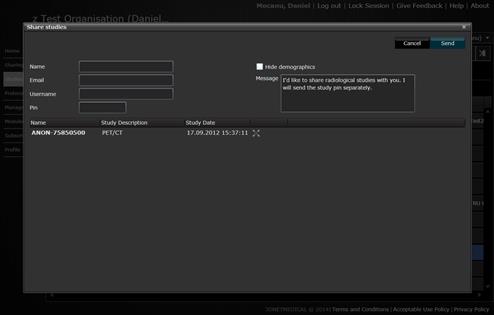
Share study feature.
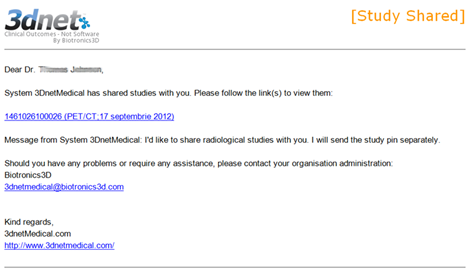
After all the information is entered, press the Send button. The recipient will receive an email with a URL link, as shown below.
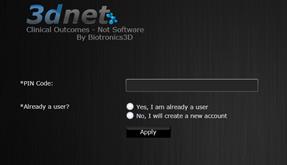
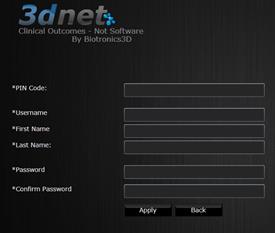
Clicking on the study will launch the following 3Dnet™ window requesting for the PIN Code. If the recepient already has an account with 3Dnet™ system will check “Yes, I am already a user” if not, then he must tick the box “no, I will create a new account”
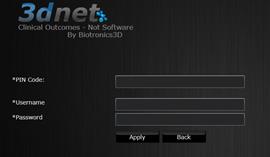
As an existing user, the recepient will be requested to enter their username and password, in addition to the PIN code.
As new user, the recepient will be requested to create an account by introducing his Username, First Name, Last Name, Password.
Once the account created, the recepient can access 3Dnet by introducing his username and password on the login page. The system will display the following page with a list of studies shared with him.
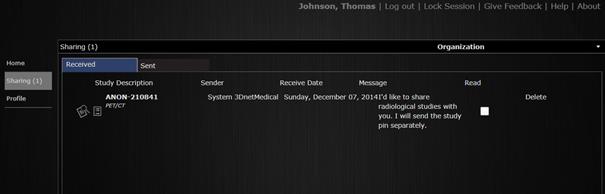
To open a study, the user clicks on ![]()
To see the report of a study, the user clicks
on ![]()
8.2 Assign study
This feature is useful for creating worklists for Reporting Physicians and Referring Physician. The study assignement to a certain user can be done in two ways:
1) Manual (described below)
2) Automatic, by reading phyisician information in the DICOM tags of the study or by reading HL7 ORM/ORU messages.
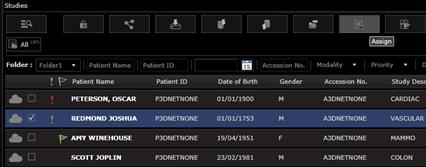
The manual assignment process in 3Dnet is very simple. First, the worklist must be set up by the Admin user (see the System administration section). Then, click on a study in the Study Browser and press the button Assign a s shown below.
A new window opens, where the user can assign a study to a Reporting
Physician or to a Referring Physician. There can be maximum 2 Reporting
Physician assignments per study and 2 Referring Physician assignments per
study.
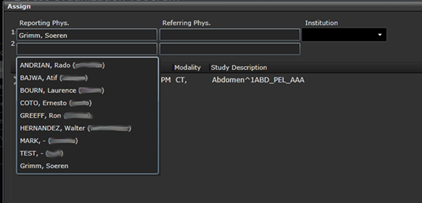
Assign a study to a user.
8.3 Folders
The Folder concept is used by 3Dnet™ to logically separate studies manually or based on some pre-defined criteria. For example, an organization with several imaging centers, can choose to set up a folder for each of the imaging center. Another example may be a hospital which desires to use folders to separate studies associated with different hospital wards: a folder for Orthopedic patients, a folder for Neurology patients and so forth. Folders can be accessed from the Study Browser directly.
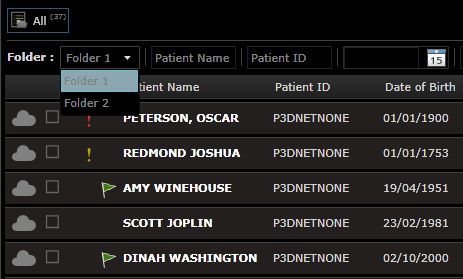
Accessing different folders.
9 System administration
System administration tools are accessible only with admin permission, from the Manage tab on the left side of your screen (figure below).
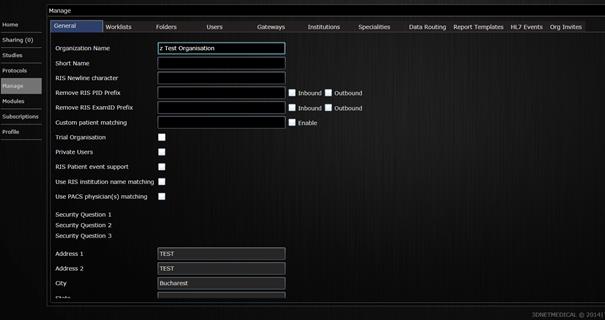
Manage tab showing the general
information for an organization.
9.1 Manage worklists
The admin user can also create, edit or remove worklists from the Manage panel. In the Worklists tab, click on the Add button to create a new worklist.
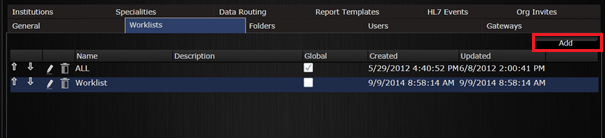
Worklists configuration.
In the form below, enter the Worklist name and description. Tick the Global checkbox if this worklist must
be seen by all users in the organization.
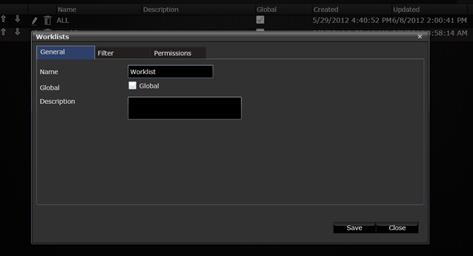
Naming a worklist.
In the Filter tab, select the
filtering criteria for that worklist. There are many options here, which are
shown in the figure below. For example if one desires to create a worklist
showing only studies of one patient, then enter the Patient Name and Patient
ID. If one desires to create a worklist with sutdies assigned to a certain
Reporting Physician then select the user from the Reporting Physician dropbox
menu.
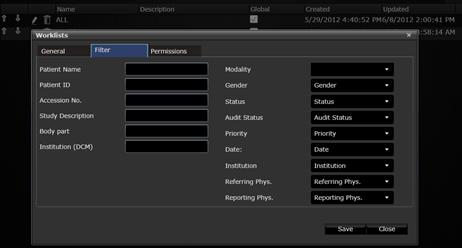
Choosing filter criteria for a worklist.
In the Permissions tab, the
admin user is able to assing access permissions to this worklist to certain
users.
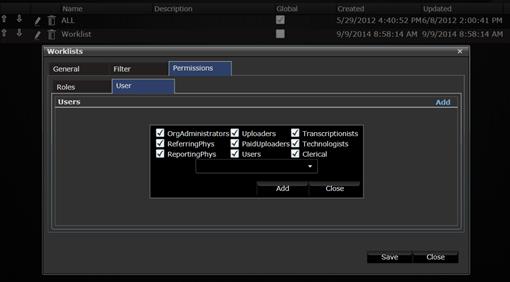
Adding user permissions.
9.2
Manage folders
3Dnet™ system also allows to
distribute the incoming studies to various folders automatically based on
information in the DICOM header, for example Instituion Name or Referring
Physician. Figure below shows how to create folder in 3Dnet. Go to the Folders tab and click the Add button.
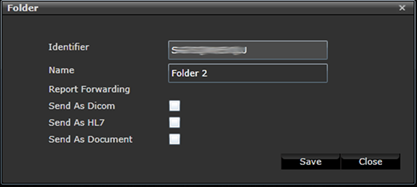
Adding a folder.
9.3 Manage users
In this panel, the organization admin can create/remove users by accessing the Users tab.
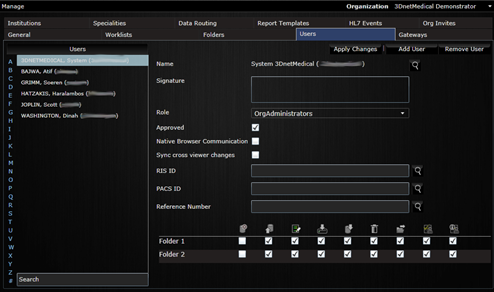
Adding users.
All users are assigned a role in the workflow: reporting physician, referring physician, OrgAdministrator, uploader, technologist, clerical, transcriptionist or patient. Different privilleges can be assigned to different users, such as ability to report, delete a study, send a study to a DICOM node, manually assign a study, etc. In the same panel, the organization admin can assign permission to a user to see certain folders in the organization.
9.4 Manage gateways
From the Gateways tab one can configure DICOM nodes and DICOM printers for comunication with 3Dnet™ DICOM server (DICOM Send, Query/Retrieve).
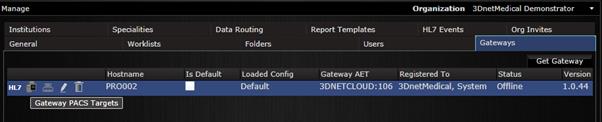
To configure a DICOM node, click on the Gateway PACS Targets icon ![]() and then click on Add New PACS.
and then click on Add New PACS.
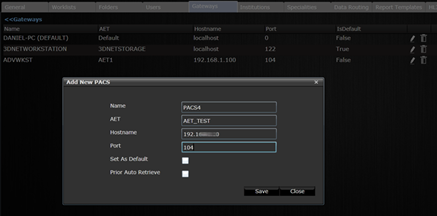
Adding a DICOM node.
The generic name PACS can denote any DICOM node in the network: modalities, modality diagnostic workstation, 3rd party viewers, 3rd party PACS systems. All can be configured to query/retrieve study from the 3Dnet™ archive. The cormmunication over LAN/WAN and over Internet with other DICOM nodes uses TCP/IP protocol and the DICOM Message Service Element standard.
To configure a DICOM film printer, click on
the Gateway Printer Targets icon ![]() and then Add New Mapping in the upper right corner. In the window below
enter printer information and then click Save.
and then Add New Mapping in the upper right corner. In the window below
enter printer information and then click Save.
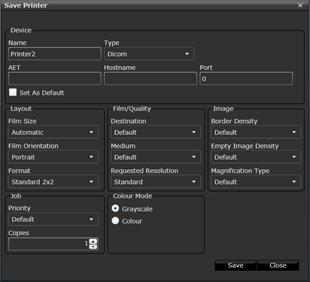
Adding a DICOM printer.
9.5 Study routing
3Dnet™ can automatically route studies to folders based on pre-defined rules. Goto the Data Routing tab to add new routing by clicking the Add button. In the window below, enter the Title (friendly name) of the new routing rule, the Folder to route to and Tag value used to route newly inserted studies. In the example below, all newly inserted studies with the DICOM Insitution Name set to “Test Site” will be routed to the Test Site folder.
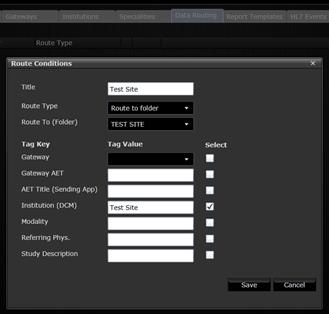
Defining study routing rules.
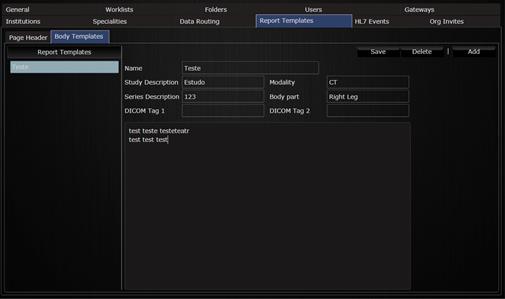
9.6 Report templates
In the Report Templates the user can create pre-defined templates for reporting.
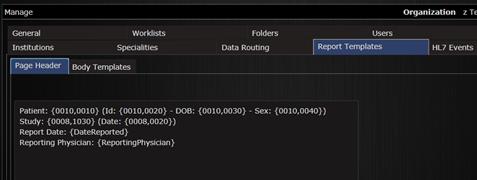
Setting up templates for report.
Setting up templates for report.
10 3Dnet™ Gateway
3Dnet™ Gateway is a stand-alone application which manages the DICOM communication between modalities or any DICOM node and a 3Dnet™ public or private cloud.
The application runs as a service and can be installed on any Windows machine in the network. 3Dnet™ Gateway supports the following DICOM commands: C-Store, C-Get, C-Find, C-Move, C-Echo, Storage Commitment, client/server Query/Retrieve.
As you can see in the picture above, in the Configuration tab the user can configure the upload method (Study Level or Series Level) as well as selecting the Compression on Disk option and enabling SSL encrypted communication (on by default).
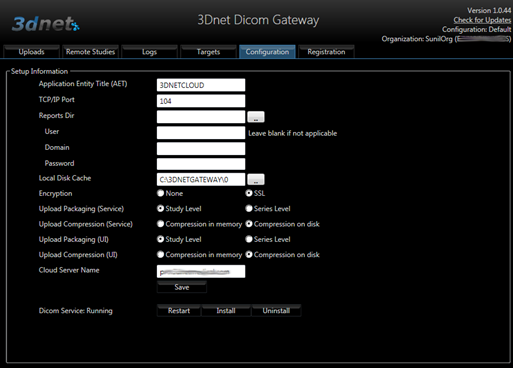
Gateway configuration.
In the Remote Studies tab there is a client Query/Retrieve feature, which allows the user to interogate other DICOM nodes within the network and to move studies from that node to the 3Dnet™ cloud archive via C-Find and C-Move commands.
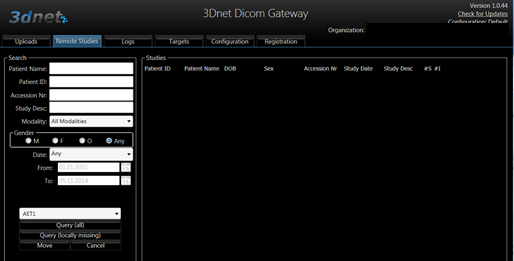
Gateway DICOM Query/Retrieve.
11 Advanced clinical software applications
11.1 PET-CT
The PET/CT Fusion & Analsys
module triggers automatically when a PET/CT study is detected by the Viewer,
provided the user has permissions to access to this module.
3Dnet™ PET-CT aims at providing the tools for
efficient tumour detection, measurement, delineation and staging, by combining
metabolic (functional) information from PET with spatial and anatomical
information from CT, in a single environment. Tumour assessment is based on
correlation finding from PET metabolic activity, evaluated in Standard Uptake
Value (SUV), and registered CT tissue characteristics (as change in HU). Each
tumour is associated to an indexed Hotspot, a Volume of Interest (VOI)
in which are derived measurement statistics such as average and maximum SUV, as
well as tumour volume.
3Dnet™ PET-CT Fusion & Analysis Application allows
tumour assessment from both hybrid systems and separate systems.
Basic Functionality
- Automatic
PET, CT image registration
- Hanging
protocols and support for multiple monitors
- Rendering
modes: MPR, VR, 3D MIP and 3D rotation
- Lesion
segmentation
- Standard
Uptake Value (SUV) computation and display
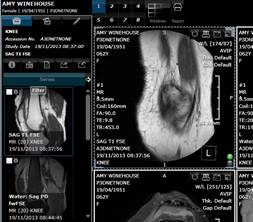
The figure below shows a possible
layout of a PET/CT study that was configured using the Hanging Protocol feature
available in 3Dnet. The Hanging Protocol divides the screen in 4 viewports,
showing the axial CT, fused axial PET and CT images, the PET image alone and a
3D MIP view which also allow rotation. The user can define his own display
protocol.
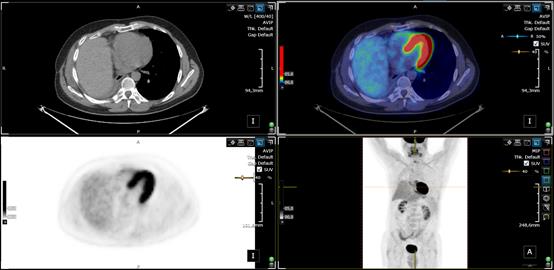
PET/CT viewer.
Changing from axial views to
sagittal or coronal views is done by simply clicking the icon ![]() in the top menu bar. To change the colormap
click on the little arrows right below the colorbar and select the desired
colormap.
in the top menu bar. To change the colormap
click on the little arrows right below the colorbar and select the desired
colormap.
The key part of the PET-CT Fusion Application is the
quantitative assessment of tumours. This is done with the measurements tools in the
Annotation panel (circle tool ). Statistics such as maximum and average SUV
within the hotspot are computed.
Using the Circle tool in the Annotations panel, one can perform volumetric
segmentation of a lesion by just clicking on it. The application reports the
statistics related to the uptake of the nuclear agent in that lesion (SUV).
Alternatively, the Circle tool can
also be used to enclose a region of interest. In this case, the software will
report statistics on SUV and HU related to that slice (see figure below).
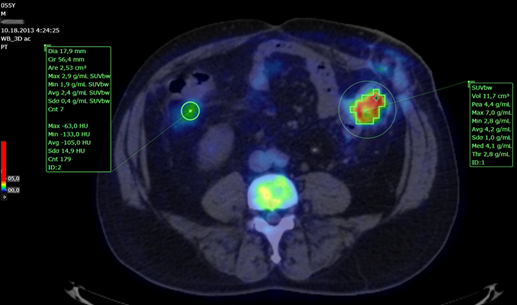
SUV calculation and display.
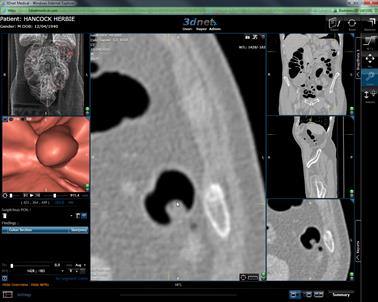
11.2 CT Colonoscopy
CT Colonoscopy is an
additional module option for 3Dnet™Medical. The module creates 2D and 3D
images of the colon, creating a more productive, quick and simple platform for
locating and analyzing suspected polyps. With
little ease, the CT Colonoscopy module lets you inspect CT colon images in
recognizable clinical presentational formats.
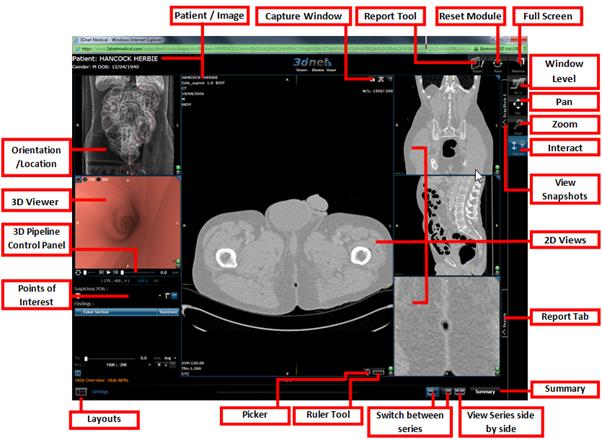
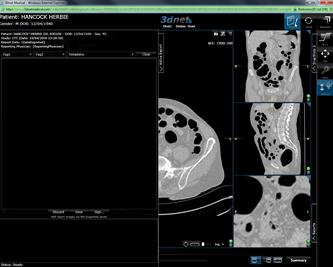
The CT Colon module is built on
3Dnet™Medical’s intuitive interface with the following tabbed screens: Browser,
Application, Viewer, Report and Help. The CT Colon module shown in the Figures
below allows you to explore the Colon in a virtual 3D and 2D environment
through a web browser on any machine anywhere in the world.
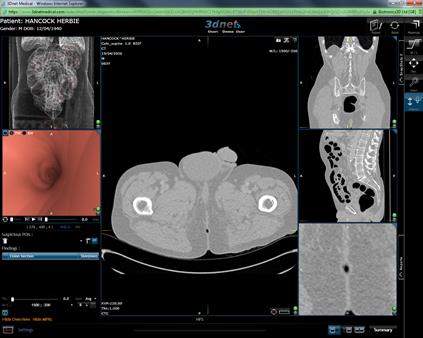
CT Colonoscopy viewer.
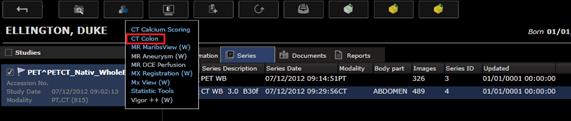
How to get to the CT Colon module
- Select the Study you
desire.
- Select the series
with a study to compare (prone & supine) by checking the box.
![]()
- Select the module
picker.
- Select CT Colon
CT Colon Tools
|
Button/Tool |
Shortcut |
Description |
|
General Tools |
||
|
|
|
Change between
resolution from high to low or low to high. |
|
|
|
Change four different
layouts. |
|
|
|
Enables you to switch
between series and also view both series side by side. |
|
|
|
Takes a snapshot of the
specific window. |
|
|
|
Resets the interface. |
|
2D Tools |
||
|
|
<CTRL> + <RIGHT-MOUSE> |
Allows you to change
the window level of the images. |
|
|
|
Allows you to moves an image. |
|
|
|
Allows you to zoom into an image |
|
|
|
Allows you to interact
and scroll through an image. |
|
|
|
The Pick allows you to
mark polyps with the right mouse button. |
|
|
|
To measure something
temporally, use the left mouse button. To button to measure a finding, use
the right mouse button |
|
3D Pipeline Tools |
||
|
|
<SPACEBAR> |
Starts
the automatic fly through. |
|
|
<SHIFT> + <SPACEBAR> |
Jumps
to the end of the fly through. |
|
|
<CTRL> + <SPACEBAR> |
Jumps
to the start of the fly through. |
|
|
|
Jumps
to selected part of the fly through. |
|
|
|
Changes
the speed of the fly through. |
|
|
|
Reverses
the fly through. |
|
|
|
Changes
the 3D view from orthographic to prospective. |
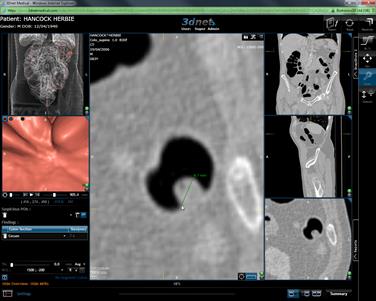
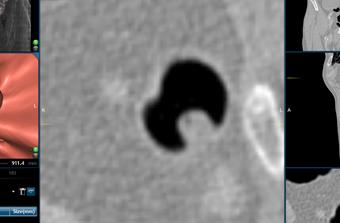
How to inspect suspected polyps
When diagnosing you may want to
inspect a possible polyp like the example circled below. To do this, follow
these simple steps:
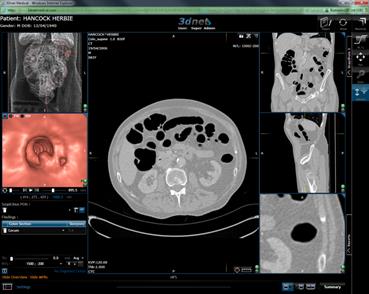
When in 3D and approaching a
polyp stop the fly through by clicking ![]() or <SPACEBAR>
then double click on the polyp and the 3D and 2D views will snap to that
location.
or <SPACEBAR>
then double click on the polyp and the 3D and 2D views will snap to that
location.
![]()
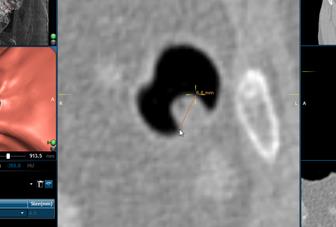
Zoom in to the 2d view using the ![]() Tool.
Tool.
Using the ![]() Tool you can measure an anything using the
left mouse button (this does not save to the study).
Tool you can measure an anything using the
left mouse button (this does not save to the study).
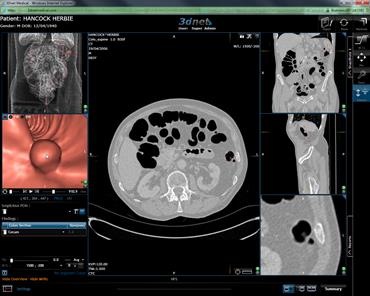
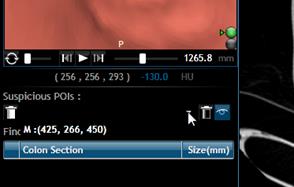
How to mark a suspected polyp as a Suspicious POI
When
looking though in an image in 3D or 2D you may want to assign items as POIs so
that you can jump to them later on. To do this, follow these simple steps:
When
in 3D and approaching a polyp stop the fly through by clicking ![]() or <SPACEBAR>
then double click on the polyp and the 3D and 2D views will snap to that
location.
or <SPACEBAR>
then double click on the polyp and the 3D and 2D views will snap to that
location.

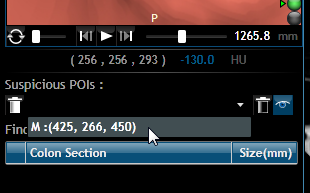
Zoom in to the 2d view using the ![]() Tool.
Tool.
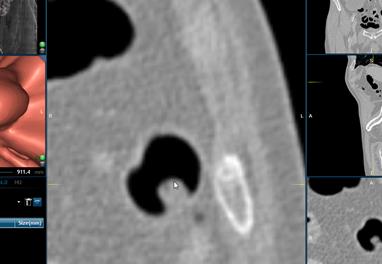
Click the ![]() Tool, and using the right mouse button select
the polyp in the 2D window.
Tool, and using the right mouse button select
the polyp in the 2D window.
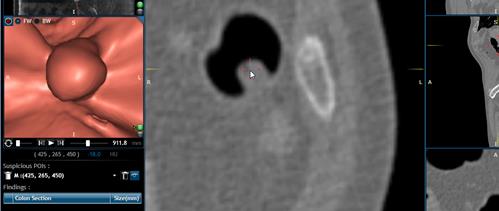
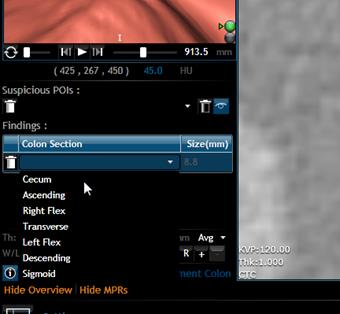
Add polyps to Findings
If
the polyp is already marked in the POIs you can save it to findings along with
the location and the size of the polyp. To do this, follow these simple steps:
Jump to the Point of Interest by
clicking the down arrow in “Suspicious POIs”.
Select from the list the polyp
you wish to add.
Now, the interface will jump to the
selected polyp. Using the ![]() Tool zoom in to the polyp in the 2D view.
Tool zoom in to the polyp in the 2D view.
Using the ![]() Tool and the Right mouse button you can
measure a finding.
Tool and the Right mouse button you can
measure a finding.
Once measured, you will see a new
item in the Findings table. You now need
to select the location that the polyp was found by clicking the down arrow.
Summarize a Study
Once
you have all your findings you can generate a summary that displays patient and
study information with details of all the findings. To do this, follow these
simple steps:
Click
![]() Tool, this will automatically generate a
summary of your findings.
Tool, this will automatically generate a
summary of your findings.
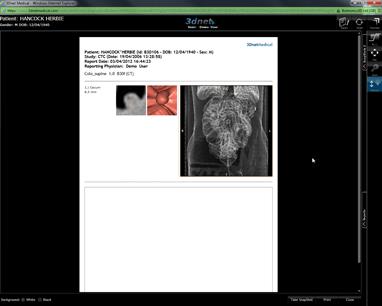
You can also add additional
information in the textbox.
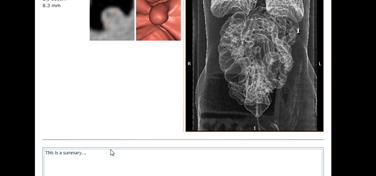
You can print this summary as it
is, or you can capture by clicking the ![]() tool to attach to a report later on.
tool to attach to a report later on.
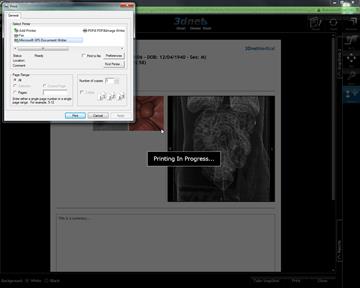
Generate a Report
Once
you have finished diagnosing you can generate a report, and you can also attach
a snapshot(s) to a report.
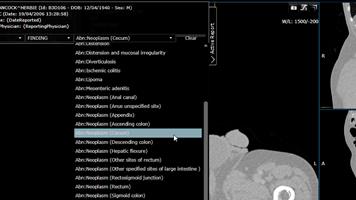
Click the ![]() Tool and a new tab “Active Report” will open.
Tool and a new tab “Active Report” will open.
Click “Tag1” select body part,
also select “Finding or “Procedure” from Tag2, then select a Template to add
from “Templates”.
To attach snapshots to the
Report, select ![]() then Add to Report icon.
then Add to Report icon.
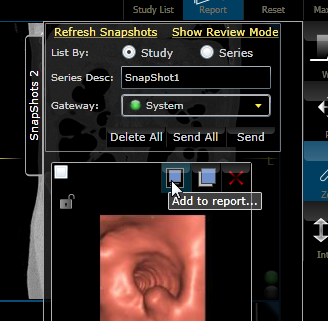
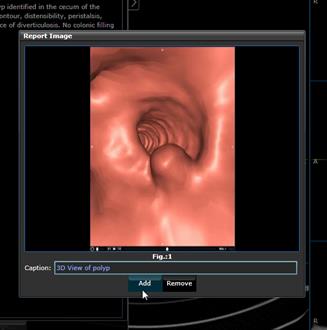
Give the snap shot a caption then
click Add. (Note: You can also import a snapshot of a summary the same way)
Once, done you can save or sign
the Report.
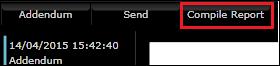
After you sign a report select
Compile Report to open it in PDF Format.
11.3 DCE-MRI
3DnetTM DCE-MRI Perfusion is a tool for
quantitative analysis of Dynamic Contrast Enhanced MRI data. This requires the
conversion of the arbitrary MR signal intensities of the dynamic sequence to
contrast agent concentration. During measurement of contrast agent uptake, the
T1 relaxation rate of a voxel at a given time during the dynamic imaging period
is calculated from the ratio of the T1-weighted signal intensity to the
proton-density (PD) weighted signal intensity acquired before contrast agent
injection. Therefore, the software requires that two series of images are
selected in the browser: One containing a reference PD-volume and one
containing the dynamic acquisition.
The DCE-MRI Perfusion module uses pharmaco-kinetic
(PK) models to estimate kinetic parameters associated with the passage of
contrast agent, such as transfer and rate constants, or leakage space, which
correlate to pathological findings of micro-vessel density and vascular
endothelial growth factor.
Once suitable data is
loaded, the software application implements a simple and intuitive workflow,
with three main distinguishable steps, each of whom has its own separate panel:
signal intensity to contrast agent concentration conversion, PK modeling and
dynamic analysis.
DCE-MRI viewer.
Process:
F Load the
dynamic and the reference series with the DCE-MRI module as described on page 9
of this User Guide.
F Select the
subtraction display mode.
F Select the
appropriate signal intensity to concentration conversion algorithm from the Conversion panel. Here, the user must
also select the contrast agent type and associated relaxativity.
F Select the PK
model that is applied to data fro the Fitting
panel. The models take input from the signal intensity converter and, using AIF
information where necessary, fit a curve to the data. Examples of models:
Tofts, Logarithmic, Exponential.
F Define the
region of interest for your analysis. Go to Analysis ROI panel and select Custom.
Select FreeHand tool to contour your
region of interest on the subtracted image. Use the right mouse button to draw.
To finish the contour press again the right mouse button.
F Press the Analysis button.
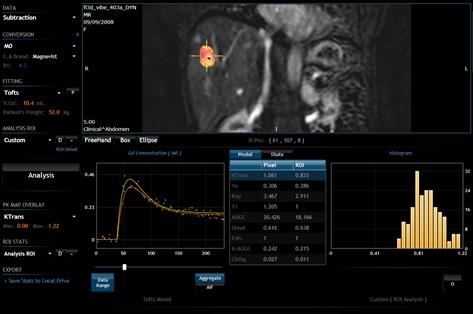
Once data has been loaded and
analyzed, the application displays the results as color overlay maps
superimposed onto the anatomical image. This is shown in figure 31.
The PK analysis calculates the following maps:
- Enhancement: This is
a binary map indicating whether or not there is contrast enhancement at a
particular voxel.
- Onset-time: This is
a measure (in minutes) of the time of arrival of the contrast to every
enhanced voxel.
- K-Trans: The
transfer constant, measured in min-1.
- Ve: The volume of extra-vascular extra-cellular
space (also known as interstitial space), as a percentage of the voxel
volume.
- Kep: The rate constant, measured in min-1.
- Vp: On the Cosine+Plasma model only, the volume
of plasma on a particular voxel), as a percentage of the voxel volume.
- Cell Fraction: On the
Cosine+Plasma model only, the volume of space occupied by cells on the
voxel, nonplasma or plasma on a particular voxel, as a percentage of the
voxel volume.
- ChiSq: Chi2
goodness of fit metric.
- IAUGC60:
Integrated Area Under Gadolinium Curve for 60 seconds following onset.
- N-IAUGC60:
IAUGC60 normalized by the IAUGC60 of the AIF.
Breast DCE-MRI Perfusion
The Breast DCE-MRI analysis assesses the type of
time–signal intensity curve (i.e. kinetic curve) by categorizing the washout
pattern of a gadolinium contrast agent. These patterns are classified as:
- Type I, persistently enhancing (progressive), suggestive of benignity;
- Type II, plateau, has an intermediate probability for malignancy;
- Type III, washout, indicative of malignancy.
3DnetTM Perfusion
module offers simple yet powerful tools to aid in the interpretation and
analysis of the kinetic curves in Breast DCE-MRI.
Load the MRI study and maximize
the viewport containing the dynamic series. To start the analysis, the user
must first check the KiM box
situated in the upper right corner of the viewer. Different colormaps are
available in the W/L menu.
Pixel by pixel inspection is
achieved by pressing the Graphic
tool ![]() in the lower right area of the screen and then
by moving the mouse over the desired regions of the breast. The application
will interactively display the intensity vs. time curves.
in the lower right area of the screen and then
by moving the mouse over the desired regions of the breast. The application
will interactively display the intensity vs. time curves.
To perform an anlaysis in a
volume of interest, select the Point
tool ![]() in the Annotate
panel and click on a lession. The application automatically segments the
respective lesion in all slices where present and displays the worst and
aggregate intensity curves in the analyzed volume as shown in the figure below.
in the Annotate
panel and click on a lession. The application automatically segments the
respective lesion in all slices where present and displays the worst and
aggregate intensity curves in the analyzed volume as shown in the figure below.
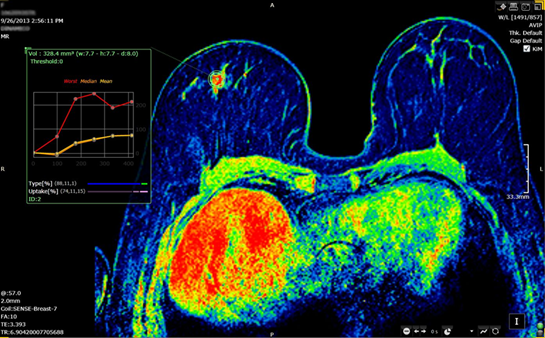
Breast MRI viewer.
In the lower right tool bar
![]() - Press this button to display
the subtracted image
- Press this button to display
the subtracted image
![]() - Press the arrow buttons to
navigate in time.
- Press the arrow buttons to
navigate in time.
11.4 CT Calcium Scoring
The Calcium Scoring module of 3Dnet™ is a tool for
determining the patient's risk for coronary arterial disease.
For detection of coronary artery calcium, non-contrast
CT volumetric data is acquired, with image thickness typically between 1.25 and
3 mm. Calcium load in the coronary arteries can be quantified from either
Electron Beam CT (EBCT) or Multi Slice CT (MSCT).
The Calcium Scoring module measures the Agatston score
(Agatston et al., 1990) and the volume of calcium, as well as average, standard
deviation and maximum Hounsfield Units (HU) of the user-selected
calcifications. The results for each vessel as well as the total scores are
tabulated on an automatically generated report.
Workflow
The Calcium Scoring
module has been designed to provide a fast an efficient workflow. The initial
step is to select a vessel to score. By default the system is pre-loaded with
coronary vessels that can be selected or edited. Once the appropriate vessel is
selected, the user assigns areas of calcium to the vessel. An overlay with
different colors according to the data HUs, highlights calcifications.
Assignment of calcium areas to a vessel can be done in the axial slices via
one-click 2D or 3D region growing, or via a lasso tool that region grows in 3D
from all the seeds inside the lasso. A table showing the per-vessel and total
calcium scorings is produced and a report is automatically generated as shown
below.
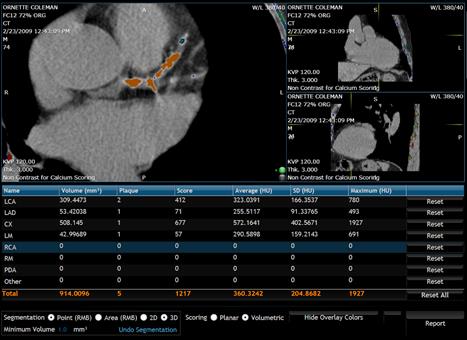
CT Calcium Scoring viewer.
The currently-active vessel is shown in a different
color to all the other vessels. The user can activate another vessel by
left-clicking on its label. The user is able to rename these vessel components
by double-clicking the left button on the name label.
The Segmentation groupbox provides segmentation functionality with several
region growing methods that assign voxels within the calcium thresholds to be
assigned to current selected vessel. There are three modes:
- 2D Region Growing: Single slice connected
components of voxels above calcium threshold. The process is activated by
right-clicking on a voxel that is above the calcium threshold.
- 3D Region Growing: Multi- slice connected
components of voxels above calcium threshold. The process is activated by
right-clicking on a voxel that is above the calcium threshold.
- Lasso: 3D region growing from a set of 2D
seeds. The lasso is drawn by left-clicking and moving the cursor. On
release a 3D region growing process is started for all the pixels inside
the lasso that are above the calcium threshold.
The Scoring groupbox allows the user to control the select either the Planar or Volumetric calculation
of the Agatston Score:
- in Planar mode, the Agatston is computed for
each slice and an overall score is computed as the sum of all the
per-slice scores. Agatston weights are calculated at each slice using the
maximum HU of that slice.
- In
Volumetric mode, a single score is computed using the maximum HU from the
whole 3D region to determine the Agatston weight.
The score groupbox
also allows the user to indicate a minimum volume below which calcium regions
are discarded from the scoring process.
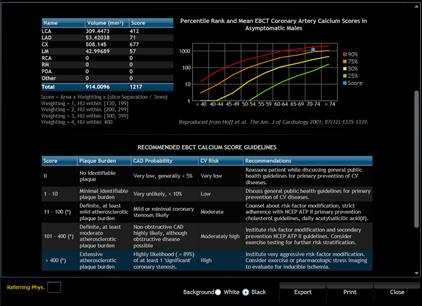
Calcium scoring report.
11.5 CT Lung
Press the the Module button ![]() and pick the CT Lung option to launch the CT
Lung clinical software application. The default user interface shows the axial,
sagital and coronal views, together with a VR image of the lungs and a zoomed
image of the VR representation, as in the figure below. Scroll through the
axial slices until you see a suspected region. To characterize the nodule, pick
the Region Growing Segmentation tool
and pick the CT Lung option to launch the CT
Lung clinical software application. The default user interface shows the axial,
sagital and coronal views, together with a VR image of the lungs and a zoomed
image of the VR representation, as in the figure below. Scroll through the
axial slices until you see a suspected region. To characterize the nodule, pick
the Region Growing Segmentation tool ![]() from the Annotate menu. Draw a small ellipse
around the nodule on any of the coronal, sagital or axial projections showing
the nodule. The software application will perform a volumetric segmentation of
the nodule and will report statistics on geometry and HU values for that
nodule.
from the Annotate menu. Draw a small ellipse
around the nodule on any of the coronal, sagital or axial projections showing
the nodule. The software application will perform a volumetric segmentation of
the nodule and will report statistics on geometry and HU values for that
nodule.
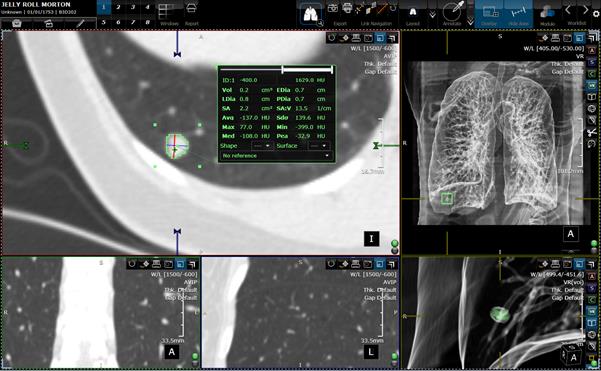
Segmentation and display of lung nodule.
The nodule is shown with green in the VR mode.
Statistics Reported
- Volume
(Vol)
- Largest
Diameter (LDia) (shown as the red line) and the largest diameter perpendicular
to it (PDia) (shown as the blue line)
- Surface
Area (SA) and surface to volume ration (SA:V)
- Maximum
,minimum, average standard deviation Hounsfield units (Max,Min,Avg,Sdo)
- Effective
Diameter (EDia), which is the diameter of the sphere with
the same volume
The Statistics
Box contains 2 Combo Boxes on which the user can select descriptions
for the following nodule characteristics:
-
Shape: Spherical, Triangular, Linear, Oval, Irregular
-
Surface: Spiculated, Smooth, Lobulated
Tumour sieze doubling
time?
The segmentation tool is using a combination of region growing and threshold based methods. It is interactive and allows the user to control the bounding box of the segmentation output. To modify the bounding ellipse click on any of the four green corners and drag the mouse on the screen.